The rest of the world is developing its vision for agentic government.

Ukraine's Agentic State (Diia.AI) · Estonia (X-Road) · Singapore (SingPass, Pair Chat) · Abu Dhabi (TAMM 3.0) · India (Aadhaar) · Australia (myGov) · New Zealand (Better Rules) · Brazil (Goiás) · UK (GOV.UK)

U.S. public health data infrastructure is being decommissioned.

Delaware's My Healthy Community (MHC)

Distributed and displayed extensive public health, education, environment, criminal justice, and economic data — from neighborhood level to statewide. The kind of infrastructure other countries are still trying to build.

Decommissioned December 31, 2025.

No archive preserved.

What's Happened to Public Health Data

Since January 2025

The Consequences Are Coming

Not just public health. Every domain of government.

2025 was the warning. Not the event. Here's what one disease looks like.

What data surveillance revealed (2020–2022)

Disparities like these are visible only when data infrastructure exists to surface them.
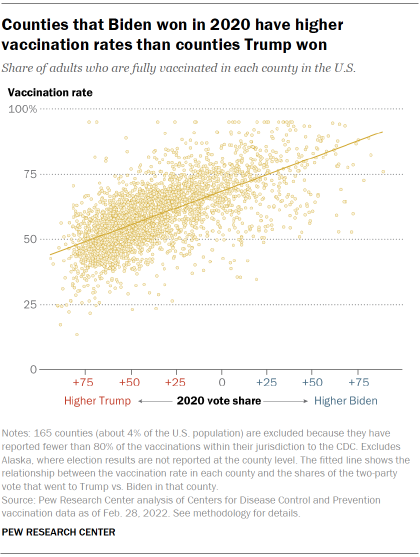
Counties that Biden won in 2020 have higher vaccination rates than counties Trump won

Pew Research Center, March 2022

170%

"The coronavirus death rate among the 20% of Americans living in counties that supported Trump by the highest margins was about 170% of the death rate among the one-in-five Americans living in counties that supported Biden by the largest margins."

Pew Research, 2022

43%

"The excess death rate among Republican voters was 43% higher than the excess death rate among Democratic voters."

Wallace et al. JAMA Intern Med. 2023

1.52x

Cumulative age-adjusted COVID-19 mortality, 2020–2023: "NH Black or African American (123.9, 95% CI: 123.3–124.5)" per 100,000 vs. "NH White (81.5; 95% CI: 81.3–81.7)". Gap narrowed from ~2.1x in 2020 but persisted.

Abidin et al. BMC Public Health 25:3257, 2025

3.05 yrs

"The Black and Latino populations are estimated to experience declines in life expectancy at birth of 2.10 and 3.05 y, respectively, both of which are several times the 0.68-y reduction for Whites." (2020)
Andrasfay & Goldman. PNAS 2021

The Response

Organizations across the country are restoring government data outside government.

These are patches. They are not infrastructure.

Delaware had this infrastructure. Put it back the way it was on December 31, 2025.

December 2014 — Health Data for Delaware proposal

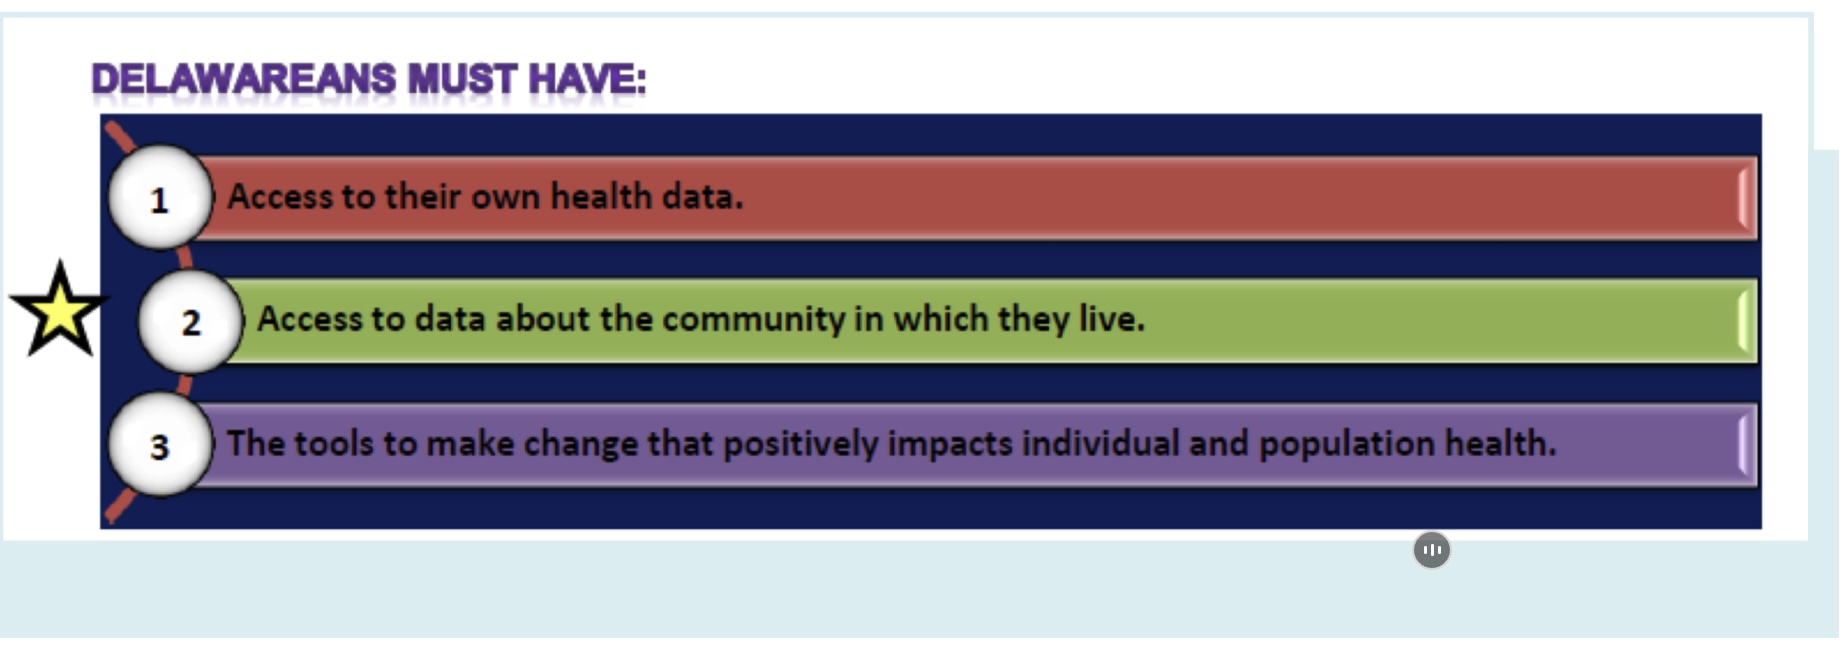
"Delawareans must have access to usable, meaningful, timely, and high-quality data about their health and the health of the communities in which they live."
Delawareans Must Have: 1. Access to their own health data. 2. Access to data about the community in which they live. 3. The tools to make change that positively impacts individual and population health.

The Architecture

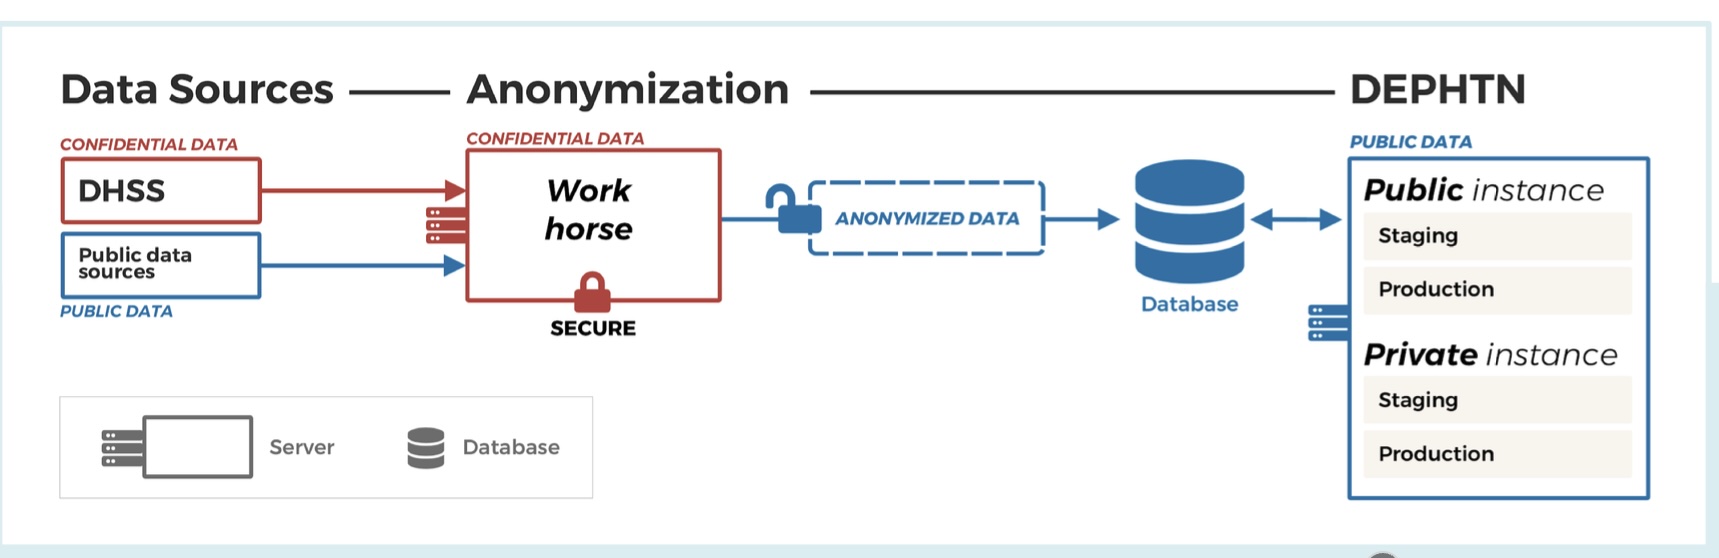
Data Sources → Anonymization → Public & Private Instances

Data Architecture: Data Sources → Anonymization → Public and Private instances

The same platform served DHSS staff (unsuppressed data) and the public (HIPAA-compliant) — two views of one system.

The HIPAA Innovation — Expert Determination, 45 CFR §164.514(b)

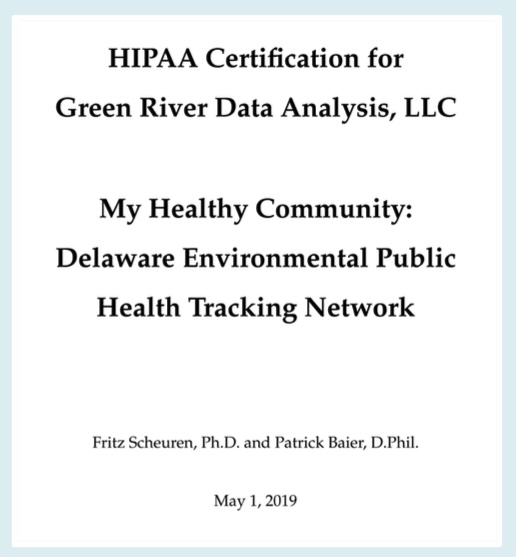
Certified by Fritz Scheuren, Ph.D. (former ASA president) and Patrick Baier, D.Phil.

  • Frequency tables: cells must have k ≥ 11 individuals and populations of 500 or more
  • No disclosure by subtraction
  • If thresholds not met, cells aggregated over time, geography, or attribute

Four Suppression Rules

  • Basic — minimum count or population not met
  • Trend-hole — suppress one year, suppress all years at that geography/variable
  • Spatial-difference — overlapping geographies reveal too-small counts
  • Latent-variable — subtracting stratifications reveals too-small counts
HIPAA Certification — Fritz Scheuren, Ph.D. and Patrick Baier, D.Phil. — May 1, 2019

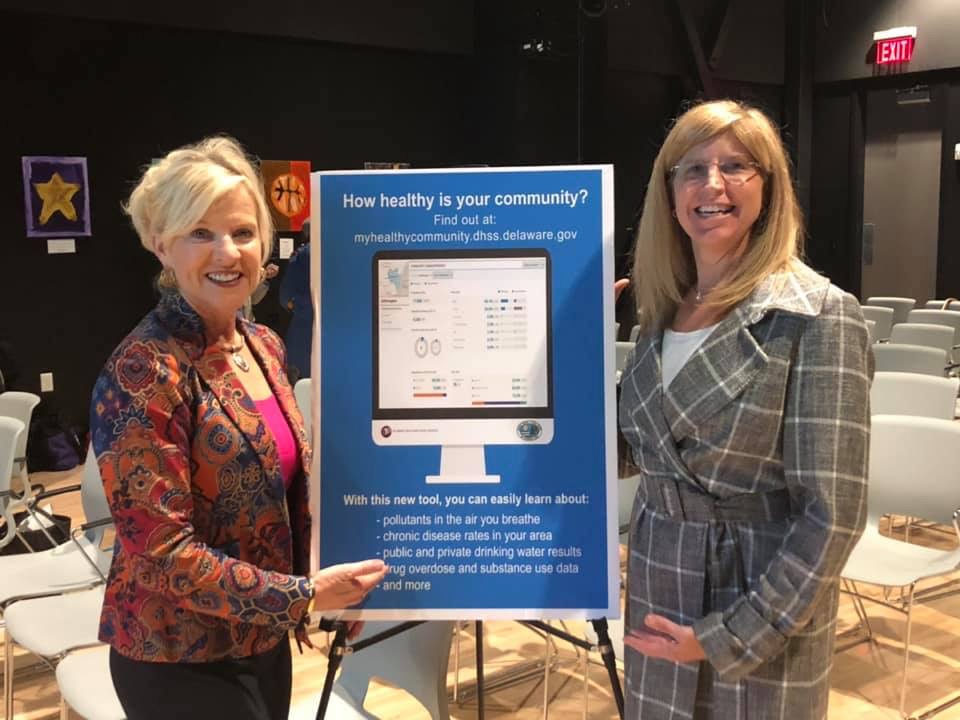
My Healthy Community — Launched May 13, 2019

Rt. 9 Library and Innovation Center, New Castle

MHC launch at Rt. 9 Library, May 2019

Launch event — five years in the making

"Making data more transparent, accessible, and easy to understand"
— then-Governor John Carney
"When communities become aware of the level at which these issues are occurring in their neighborhoods, it can spur action"
— then-DPH Director Dr. Karyl Rattay
"Access to data is a key factor in making progress toward a stronger and healthier Delaware. The ability to easily access such crucial information like substance use and overdose data by ZIP code enables Delawareans to compare it to larger areas and examine trends."
— then-Lt. Governor Bethany Hall-Long

The COVID Pivot

The US response was slow and inadequate. But MHC was already built — the COVID dashboard stood up in weeks because the infrastructure existed.

500K+
Peak Unique Users / Month
1st
State with census block group
pandemic data
"MHC is an amazing asset for us as a state in so many ways. Right now, being able to use this platform to bring transparency to the public around Delaware COVID data is huge… Please know the work you do matters greatly."
— Dr. Karyl Rattay, then-DPH Director

MHC's COVID-19 Data Architecture

Data Flow for MHC Coronavirus Dashboard

Data flow for MHC's coronavirus dashboard showing the data sources required for public and internal display. (Offutt-Powell et al., DJPH, 2021)

This Is What Delaware Had

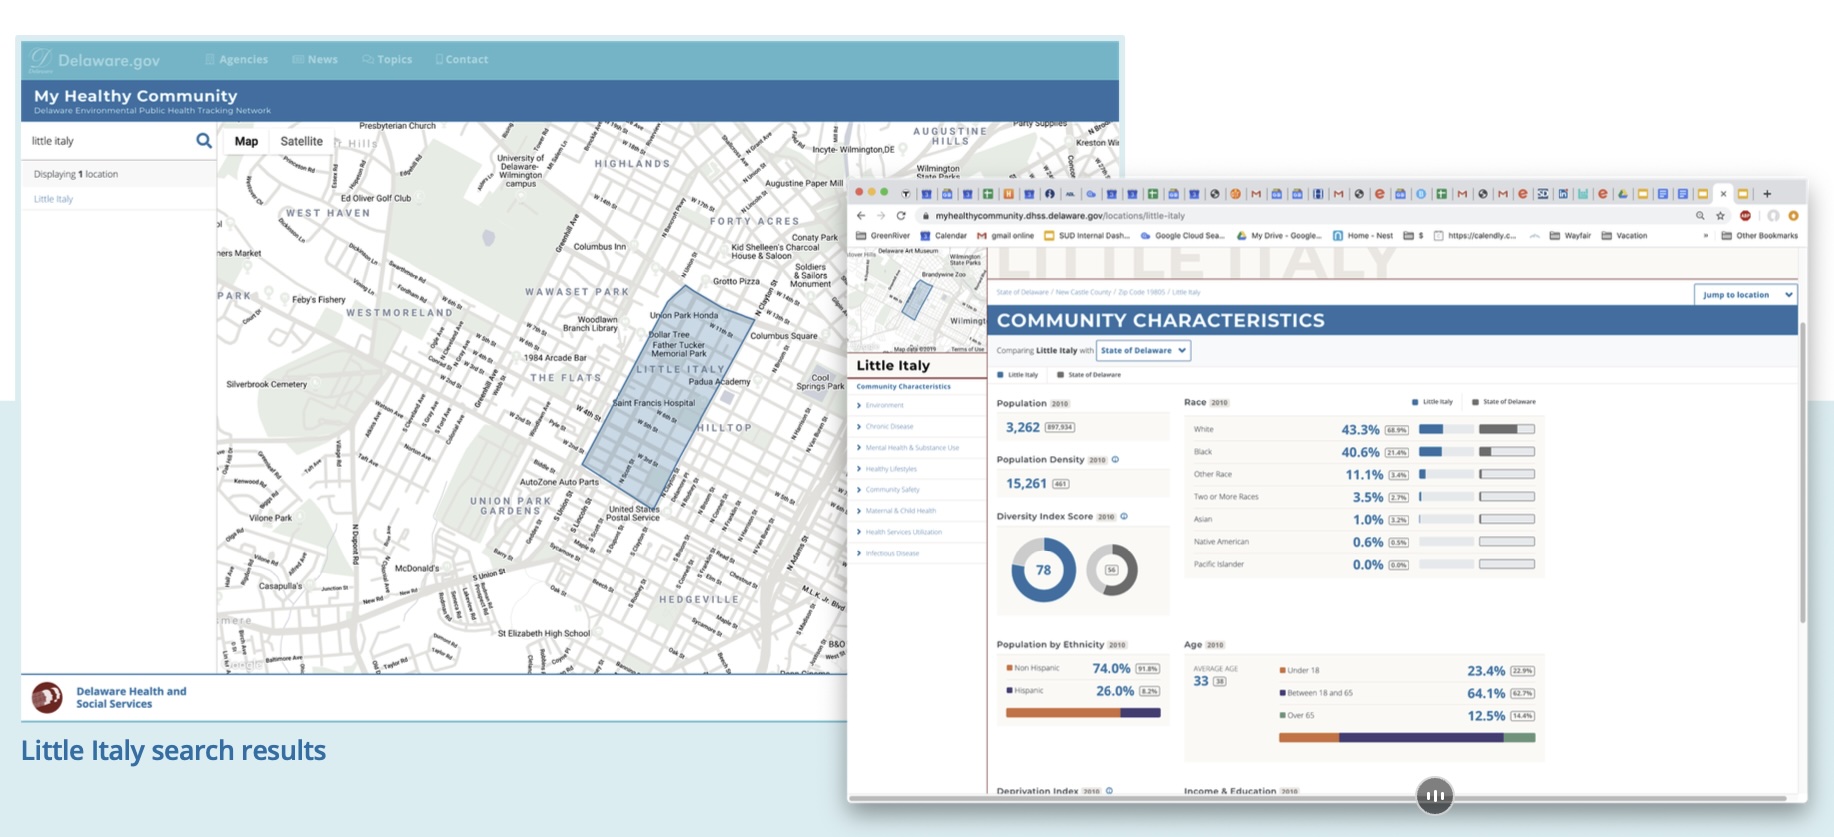
Little Italy, Wilmington — search, map, community characteristics

Presented to the CDC's Geographic Working Group in March 2019, two months before the public launch and a year before the pandemic.

"Typing in an address to see what data were available for your specific geography was so meaningful."
— Dr. Tabatha Offutt-Powell, former State Epidemiologist

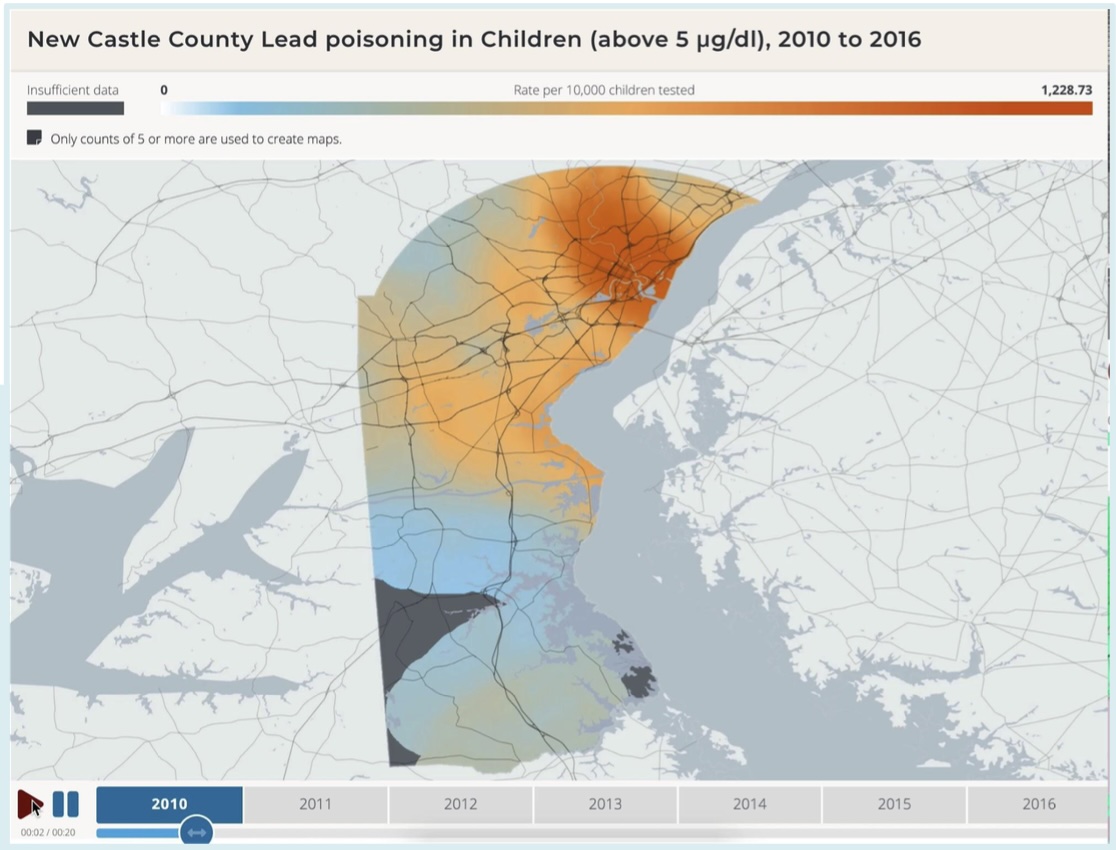
Movies of Disease

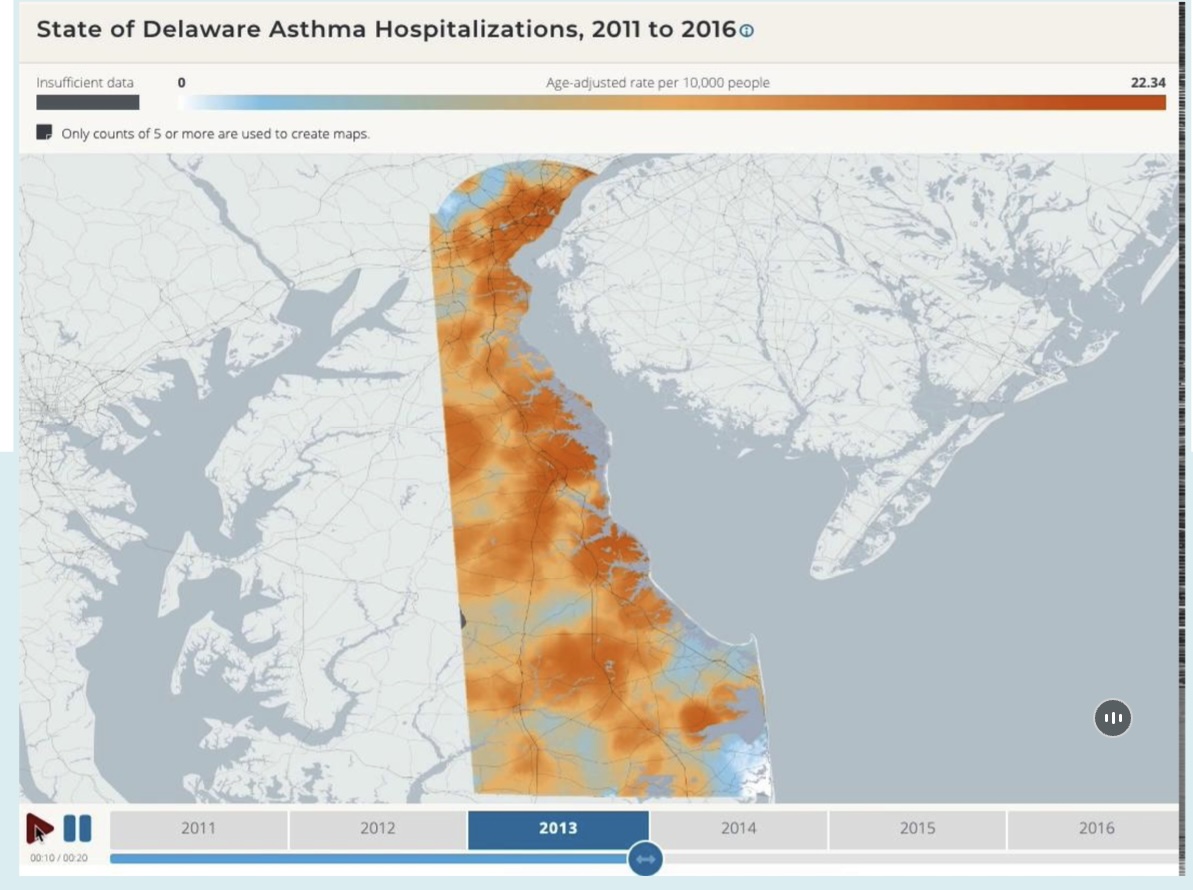
State of Delaware Asthma Hospitalizations, 2011-2016 New Castle County Lead Poisoning in Children, 2010-2016

Animated maps of disease over time and space, at any spatial resolution — statewide or county level.

Equity Counts Data Center

Built in collaboration with United Way of Delaware and the Delaware Racial Justice Collaborative

Health
ACEs, cancer, diabetes, heart disease, screenings
Education
Graduation rates, suspensions, proficiency by grade
Criminal Justice
Weapons, fights, police contact, parental incarceration
Wealth Creation
Poverty, income, SNAP, broadband, rent burden, ADI
Community Overview
Population and density by census tract

Equity Counts Data Center — Media Coverage

WHYY — November 2022

"New online dashboard tracks racial and economic disparities in Delaware"

A collaboration between United Way of Delaware, the Delaware Racial Justice Collaborative, and the Division of Public Health — built on the My Healthy Community platform.

whyy.org/articles/delaware-health-disparities-dashboard

The Equity Counts Data Center showed disparities at the ZIP code level — 17% of Delaware children in poverty statewide, but nearly 50% in some ZIP codes.

This data is no longer available.

More of What Was Lost

Data Storytelling
Narrative-driven health data — scope, demographics, geography, trends, response
Climate and Health
Heat stress, vulnerability indices, climate-related health indicators
Social Vulnerability — Census Tract
SVI at the tract level — community-level vulnerability data
Prescription Monitoring Program
ZIP code-level opioid prescribing, risk scores, treatment gaps. Updated Sep 2025.
Opioid Crisis — Data Story (Rebuilt)
More than one Delawarean dies from a drug overdose each day. Rebuilt from original source code.
Equity Counts Data Center
Health, education, criminal justice, wealth creation — built with United Way and DRJC

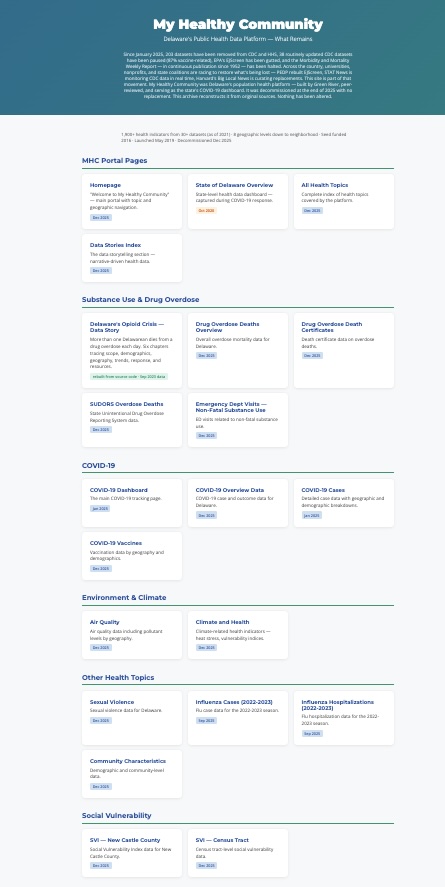
A Few Last Fragments of Delaware's Public Health Intelligence Platform

My Healthy Community — What Remains archive

These are the fragments I was able to preserve.

They are a fraction of what Delaware built.

→ Open the archive

What Was Lost

27
flat CSV files on the
Open Data Portal
vs.
2,000+
indicators, information visualization,
and reports across many spatial
and temporal resolutions on MHC

Bring MHC back online. Study what was built. Learn from it.

This platform can be restored as a public archive. It should be.

→ View the archive

1 / 25